
Measurement
Part of Why connected TV advertising measurement needs a plan before launch
How to assess connected TV advertising benchmark evidence
A practical method for assessing connected TV advertising benchmarks: define the decision, score evidence consistently and report its limitations clearly.
What to take away
- A benchmark is only useful when you can name who measured it, when, and on which supply path.
- Start from the metric you report to finance, not the one the platform finds easiest to expose.
- Score every source with a rubric before it enters the plan.
- Rebuild quarterly, because streaming inventory moves faster than annual planning cycles.
A planner in Manchester is asked to justify a connected TV advertising budget for two quarters. Finance wants one chart. Four platform decks arrive, each with a different completion rate and a different definition of a view. That gap is where benchmark research starts.
Decide what the benchmark must answer
Write the question before you collect numbers. A benchmark that answers "is connected TV working for us?" is too broad to test. One that answers "what did a 30-second spot on broadcaster video-on-demand cost per completed view last quarter?" can be checked.
Too Broad vs Testable Question
Too broad
- Question
- Is CTV working?
- Specificity
- No unit defined
- Supply path
- Unstated
- Period
- Vague
- Decision tied
- None
Testable
- Question
- Cost per completed view
- Specificity
- 30-second spot
- Supply path
- Broadcaster VOD
- Period
- Last quarter
- Decision tied
- Budget or placement
Keep the question tied to a decision. If no budget, creative or placement choice changes when the number moves, the metric is decoration. Our guide to connected TV advertising measurement and reporting treats reporting as a design choice rather than a monthly chore.
Where benchmark numbers come from
Public sources rarely publish connected TV rates at the granularity planners want. Regulators publish rules, not price lists. Useful UK context includes BARB’s television audience measurement, Thinkbox’s TV research and Ofcom’s media-market reporting; these can frame audiences and viewing, but they are not interchangeable CTV price datasets. Platforms publish their own definitions, which are not comparable across sellers.
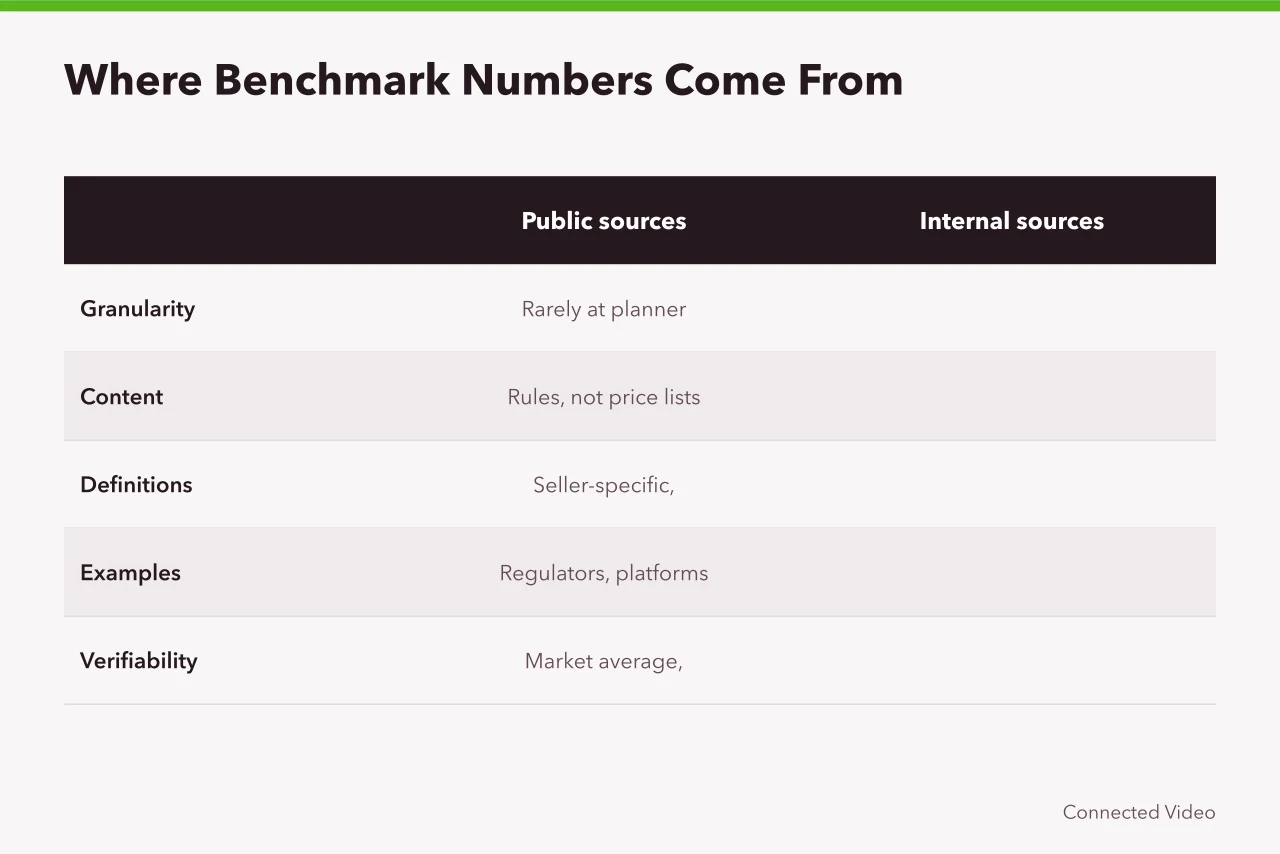
Most usable benchmarks are therefore internal: your past campaigns, an agency's aggregated buys, or a syndicated panel you pay for. Label the origin of every figure.
For audience planning rather than price benchmarking, consult Thinkbox’s BARB glossary: it explains that TGRs from Kantar Media’s TGI Survey are fused with BARB TV data to support planning against broader target audiences. Treat this as audience context, not a CTV-specific cost or outcome benchmark.
For example, a team paying £400 a month for a small always-on test can calculate cost per completed view from its own invoices rather than quoting a market average it cannot verify.
Build a scoring rubric
Score each candidate source out of 20 before it reaches the plan. Anything below 12 is context only, never the basis for a budget line.
| Criterion | What good looks like | Score |
|---|---|---|
| Named source | Publisher, analyst or platform is identified | 0-4 |
| Date | Publication date is within the last four quarters | 0-4 |
| Method stated | Sample, panel or census method is described | 0-4 |
| Definition clarity | View, impression and completion are defined | 0-4 |
| Comparability | Supply path and device mix are stated | 0-4 |
Run the same rubric over your own historical data. Internal numbers often score well on method and date but poorly on comparability, because buying routes changed between campaigns.
Check the rules and the consent trail
Advertising compliance is placement-specific. The Online Safety Act explainer provides wider online-safety context, not a substitute for advertising codes. Check the ASA’s CAP Code or the BCAP Code as applicable, and record which rules applied when the data was collected.
Consent and tracking are the second half of that picture. The ICO's guidance on online tracking and ad tech compliance explains what counts as valid consent for advertising technology. Assess UK GDPR and PECR alongside the ICO guidance when a benchmark relies on personal data or tracking. Where a benchmark relies on cross-device matching, note how consent was captured.
Link benchmarks to attribution
A benchmark tells you what a typical result looks like. Attribution tells you whether your campaign caused it. Planners who skip the second step end up defending last-click numbers in a channel built for reach.
Our breakdown of connected TV advertising attribution methods compares the main approaches and their trade-offs. Read it before promising finance a clean cost per acquisition.
Present the benchmark without overclaiming
One table, one source note, one limitation. State the period, the supply path and the sample. If the data covers England only, say so. If it covers the whole UK, say that instead.
Media planning is an organisational process as much as an analytical one. Use a source note such as: source and owner; reporting period; supply path; sample; metric definition; and known limitation. This gives reviewers the context needed to assess the figure.
Common questions
How many sources should a benchmark use?
Three to five is usually enough. One gives no sense of range, and more than five slows the review without improving the decision.
Should benchmarks use cost per completed view or cost per impression?
Include both where the seller supplies them. Completion rates vary by format and placement, so one impression-based figure hides too much.
How often should benchmarks be refreshed?
Quarterly for active channels, annually for planning assumptions. Note the refresh date on every chart so nobody quotes stale figures.
Can we use platform-published benchmarks?
Yes, but score them first. Platform data often scores well on definition clarity and poorly on comparability, because it covers only that platform's inventory.